

its common wise guy prog knowledge
the minimum wage peaked at around ten bucks in constant dollars back in 1968
now its what ?
$ 7.25 ?
this graph shows constant (pink ) and current (blue) rates
thru 2005 --just before the last increase flurry up from 5.15 to the current 7.25 in '09 ---

lets say this reduction increased participation
look it jiggered around for nearly two decades prior to the crest in the minimum
so starting there at great society heights
the participation rate
moved up from 60% to a peak of 67% in the last years of the clinton miracle
so far so good
but then what
we're back to where we were in 1980 at 64%
clinton perspective
7% more jobs for a 25% cut in base pay
barry years
4% participation for the same 25% pay cut
----- min wage has wobbled around going no where since 2000----
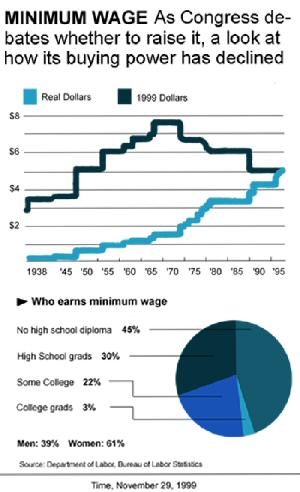
note women are 60% of min wwage workers
look at gal participation rate dynamics

guys

look similar ?
the two rates are now only 10% apart versus more then 35 % apart
when LBJ showed his pecker to goldberg
No comments:
Post a Comment