i think we might look at this hypothetical system
we set not a minimum hourly wage rate
but design an algorithm
that lifted the minimum wage
by cpi plus n% a year
n to be some thing like 10%
how would wage share in gdp develop
if the system
was driving the nominal bottom up up up ?
this is not to slight in any way
the static question
what is the optimal min to median ratio ?
just in addition
let's consider
the change in the price system
the operating mark ups
if firms ...even firms
that never pay as low as
the minimum to any hires...
what if they knew they faced this relentless nominal wage push coming at them
from the bottom up

Tuesday, March 26, 2013
hegel lesson for the day
the government, the individual citizens
and the needs or external life of the individuals, are three terms, each
of which is the middle of the other two. The government is the
absolute centre in which the extreme of the individuals is united with
their external existence; similarly, the individuals are the middle term
that activate that universal individual into external concrete existence
and translate their moral essence into the extreme of actuality. The
third syllogism is the formal syllogism, that of an illusory show, in
which the individuals purport to be linked to this universal absolute
individuality by their needs and external existence; a syllogism which,
as merely subjective, passes over into the others and in them has its
truth.
okay so the SSA's retirement system is actually soiund....but but but ...what about its disability payment system
"The typical DI beneficiary is in his or her late 50s — 70 percent are over age 50, and 30 percent are 60 or older — and suffers from a severe mental, musculoskeletal, circulatory, respiratory, or other debilitating impairment. His or her earnings fell sharply in the years before applying to the program. Only a minority of beneficiaries can do any work, and even fewer are able to do substantial work (enough to support themselves without help), studies generally conclude"

of course the word here is not "work"
as in do ANY work
but get ANY job
and obviously
the training and attention on the job
to learn how to hold on to it
great job based society we got here
if you are easily and costlessly exploitable
otherwise
you get benched
and your fellow jobsters pay you a "retainer"
Monday, March 25, 2013
the wage stag now past 40
Year Weekly Earnings (1982-84 dollars)
1972 $341.73 (peak)
1975 $314.77
1980 $290.80
1985 $284.96
1990 $271.10
1992 $266.46 (lowest point; 22% below peak)
1995 $267.17
2000 $285.00
2005 $285.05
2010 $297.79
2011 $295.49
2012 $294.83 (still 14% below peak)
1972 $341.73 (peak)
1975 $314.77
1980 $290.80
1985 $284.96
1990 $271.10
1992 $266.46 (lowest point; 22% below peak)
1995 $267.17
2000 $285.00
2005 $285.05
2010 $297.79
2011 $295.49
2012 $294.83 (still 14% below peak)
the wipe out of mass white collar jobs...disguised inside some ivy crowned gibberish
"This paper examines shifts over time in the relative demand for skilled labor in the United States. "
" Although de-skilling in the conventional sense did occur overall in nineteenth century manufacturing, a more nuanced picture.."
see that word "nuance "struggle rangers
and put your neurons into algorithmic lockdown
" the share of “middle-skill” jobs
– artisans –
declined "
while
" high-skill”
– white collar, non-production workers –
and “low-skill”
– operatives and laborers -
increased. "
nuance ?
sounds like what we knew all along
but soft....
"De-skilling did not occur in the aggregate economy"
" the aggregate shares of low skill jobs decreased, middle skill jobs remained steady, and
white collar jobs expanded from 1850 to the early twentieth century."
------------------------------------------------------
comes the reckoning :
" The pattern of monotonic skill upgrading continued through much of the twentieth century until the recent “polarization” of labor demand since the late 1980s."
white collar jobs clobbered by automation ?
ending the long era when
" ... the demand for white collar workers
grew more rapidly than the supply starting well before the Civil War."
moral of tale ?
an old one
eventually they come for you too
Sunday, March 24, 2013
un ending ....wage eraners stage a custer's last stand.....get caught in a in a time loop


behold
the "sorry no raise this time kids "
cobra
Saturday, March 23, 2013


corporate pension pay out exposure estimated to be over two trillion
nice vanishing act potential there eh ?
the ultimate retirement plan insurer ?
uncle's treasury
btw mr and mrs job stiff
which do you place greater faith in ?
that two trillion dollar group promise
or uncles two trillion plus
in the SSA trust funds
the ultimate retirement plan insurer ?
uncle's treasury
btw mr and mrs job stiff
which do you place greater faith in ?
that two trillion dollar group promise
or uncles two trillion plus
in the SSA trust funds
Friday, March 22, 2013
post credit crisis mass swap down.... mid to low wage jobs
"About two-thirds of all job losses resulting from the recession were in moderate-wage occupations, such as manufacturing, skilled construction, and office administration jobs. "
" these occupations have accounted for less than one-quarter of subsequent job gains."
" The declines in lower-wage occupations--such as retail sales and food service--accounted for about one-fifth of job loss,"
" a bit more than one-half of subsequent job gains. "
" recent job gains have been largely concentrated in lower-wage occupations
such as retail sales, food preparation, manual labor, home health care, and customer service "
"about one-quarter of all workers are considered "low wage"
"low wage was defined as $23,005 per year or $11.06 per hour"
"the average wage for new hires have actually declined since 2010."
net job creation rate : nothing to get drunk about
Monthly Job Growth

Source: Bureau of Labor Statistics.
Thursday, March 21, 2013

Wednesday, March 20, 2013

bad graphics can tell the truth anyway

we fell way more but began recovery a bit sooner and rose faster in the barry recovery
then in the bush recovery
but by now the bush recovery had restored prior job peak
not so barry reovery
now look at the clinton recovery
ya .......different

Tuesday, March 5, 2013
Riberty hired by the retail detail
The herb sorrel institute has morphed
Into the retail detail
Why?
I guess I don't know why
But I do know the studio union movement has no place anymore
for this particular third generation sorrel
Staying close to Hollywood ?
Sure
but now it's hollywood Florida
Just 10 miles south of here ... as the pelican flies
I hear the surf of atlantic America singing
The first sorrel to hear it since grand daddy'd daddy left the ozarks for mr bryan's lot boom
Guest post by riberty rhee
We need to replace the income tax with a tax on wealth and a tax on human capital
I'll focus on the hu-cap tax
Potential annual Earnings are assessed and taxed with a progressive tax rate schedule
Perhaps with an opening negative tax interval
Assessment by a complex algorithm including experience skill set and back ground life time earnings
Think by perfect analogy
Of a george tax
A tax on ground rent
Consider this as a anti parasitism law converted into a hidden talent excavator
Recall the neo classical perfection
No tax at the extensive margin of effort this coming year
Monday, March 4, 2013
greaser count ..by a bogus outfit but look anyway
- Maids and housekeepers: 55 percent native-born
- Taxi drivers and chauffeurs: 58 percent native-born
- Butchers and meat processors: 63 percent native-born
- Grounds maintenance workers: 65 percent native-born
- Construction laborers: 65 percent native-born
- Porters, bellhops, and concierges: 71 percent native-born
- Janitors: 75 percent native-born
make way for the gals and the greasers...participation rate and the swooning minimum wage

its common wise guy prog knowledge
the minimum wage peaked at around ten bucks in constant dollars back in 1968
now its what ?
$ 7.25 ?
this graph shows constant (pink ) and current (blue) rates
thru 2005 --just before the last increase flurry up from 5.15 to the current 7.25 in '09 ---

lets say this reduction increased participation
look it jiggered around for nearly two decades prior to the crest in the minimum
so starting there at great society heights
the participation rate
moved up from 60% to a peak of 67% in the last years of the clinton miracle
so far so good
but then what
we're back to where we were in 1980 at 64%
clinton perspective
7% more jobs for a 25% cut in base pay
barry years
4% participation for the same 25% pay cut
----- min wage has wobbled around going no where since 2000----
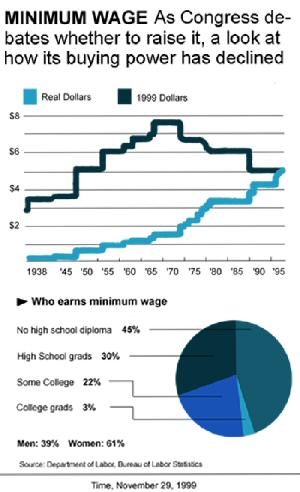
note women are 60% of min wwage workers
look at gal participation rate dynamics

guys

look similar ?
the two rates are now only 10% apart versus more then 35 % apart
when LBJ showed his pecker to goldberg
The min index is a good struggle node
The minimum wage wars may heat up
Consider this
The federal minimum wage around $15 dollars per hour and indexed
That might be a reasonable goal
The wage structure as is for many reasons good and not so good
Is not top of the mind for most job class types
We have little notion of how our neighbors are arranged in a compensation hierarchy
We might consider a clear diagram
Of this our class our society profile
as a start to comprehension
Shifting proportions between mid pay and low pay jobs
"A recent presentation from the Federal Reserve Bank of San Francisco lays out the situation clearly. The vast majority of job losses during the recession were in middle-income occupations, and they’ve largely been replaced by low-wage jobs since 2010:Mid-wage occupations, paying between $13.83 and $21.13 per hour, made up about 60 percent of the job losses during the recession. But those mid-wage jobs have made up just 27 percent of the jobs gained during the recovery.
By contrast, low-wage occupations paying less than $13.83 per hour have utterly dominated the recovery, with 58 percent of the job gains since 2010. (This data all comes from an earlier report (pdf) from the National Employment Law Project.)"
Subscribe to:
Comments (Atom)